Comparing efficiencies of Fixed vs Chassis switches
When building a fabric for a cluster of servers and storage in the data center, how should you architect the network? There are several ways to approach this. The architecture you choose probably depends on your preconceived notions of what a network should look like and addressing the things that you care about. For example, does power and space efficiency matter at all? It usually does, given these are often finite and costly resources. The more power and space given to the network means less power and space given to storage and compute – the stuff that actually provides a return.
With that in mind, which architecture and switch platforms might work best when space and power are taken into consideration? Lets take a quick look at comparing the power and space efficiency of Fixed switches vs. Chassis switches. I will make the observation that fixed switches continually outpace chassis switches in power and space efficiency.
Power efficiency
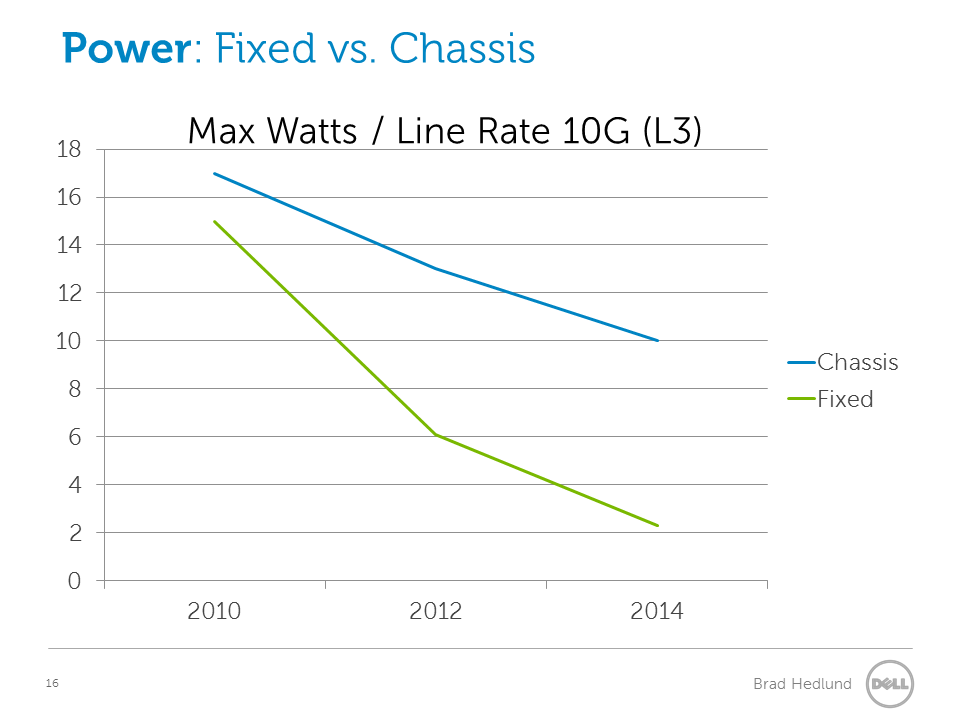
The line graph above shows the maximum rated power per line rate L2/L3 port. We are looking at the most dense platform for that year and from the data sheet we divide the max power by the number of ports. For the Fixed switches, I could have used data from the lower power single chip platforms, but to be extra fair we are looking at the higher power multi chip platforms (eg. Dell Force10 Z9000). I did not include 2008 because the chassis data for that year was so high that it skewed visibility for the remaining years. Chassis switches got significantly better in 2010 thanks to some new players in that market (namely Arista).
Note: Projections for 2014 are based on the trend from previous years.
Space efficiency

The line graph above shows the line rate L2/L3 port density of the most dense platform that year, Chassis vs Fixed. Pretty straight forward. We take the number of ports and divide it by the required rack units (RU). While each platform is getting better, the port density of fixed switches continually outpaces chassis switches with no end in sight.
Conclusion
Fixed platforms are more power and space efficient than chassis platforms, by a significant margin, year after year.
Some might say: “Yes, Brad, this is obvious. But comparing chassis vs fixed is not a fair comparison, and its silly. You can’t build a scalable fabric with fixed switches.”
My response to that: Think again. Perhaps it’s time to question the preconceived notions of what a network architecture should look like, and the form factors we instinctively turn to at each layer in the network . Ask yourself a very basic question: “Why do I want so many ports shoved into one box?” Are you building a scalable network? Or are you designing around arcane Layer 2 network protocols?
What would an efficient and scalable network look like if we could eschew the premise of arcane Layer 2 protocols (STP)? And instead build the network with new alternatives such as TRILL, OpenFlow, or Layer 3 fabric underlays with network virtualization overlays (VXLAN, NVGRE, STT).
What would that network look like?
Follow-up posts:
-
Architecting Data Center Networks in the era of Big Data and Cloud
-
Comparing fabric efficiencies of Fixed vs Chassis based designs, non-blocking
Data:
Chassis density
2008 – 3 (Nexus 7010 w/ 64 @ 21RU) M1-32 linecard
2010 – 34 (Arista 7508 w/ 384 @ 11RU)
2012 – no change, Arista 7508 still most dense
2014 – anticipated 96pt per slot w/ current chassis
Fixed density
2008 – 24 (Arista 7124, Force10 S2410) @ 1RU
2010 – 48 (Arista 7148) @ 1RU
2012 – 64 (Broadcom Trident) @ 1RU
2014 – anticipated 128pt @ 1RU
Chassis power
2008 – Nexus 7010 w/ 8 x M1-32 = 8400W max (64 ports line rate), 131W / line rate port
2010 – Arista 7508 = 6600W max / 384 ports = 17W
2012 – Nexus 7009 w/ 7 x F2 = 4595W max / 336 = 13.6W
2014 – Anticipated 25% decrease = 10.2 (based on a 25% decrease from prior 2 years)
Fixed power
2008 – Arista 7124SX – 210W / 24 ports = 8.75 W / line rate port (single chip)
2010 – Arista 7148SX – 760W / 48 ports = 15.8 W / line rate port (multi chip)
2012 – Broadcom Trident+ based platforms – 789W (Dell Force10 Z9000) / 128 line rate ports (multi chip) = 6.1W
2014 – Anticipated 60% decrease = 2.4W (based on a 60% decrease from prior 2 years)
Cheers,
Brad