Demo: End to end, hop by hop, physical and virtual network flow visibility with NSX
You’ve probably heard it before. The myth goes something like this: “With software based overlays, troubleshooting in real-time where a flow is going with ECMP hashing on the fabric is going to be a real problem.” The implied message being that this can only be possible with special hardware in a new proprietary fabric switch.
I’ve heard this one a number times, usually while seated comfortably in a session presented by a vendor who’s invested in the failure of software-centric network virtualization such as VMware NSX. As if this person has never heard of Netflow? Or maybe they assume you won’t bother to do the research, connect the dots, and in fact discover all that is possible.
Well, guess what? I decided to do the research :-) And I put together a short demo showing you just how simple it is to get this troubleshooting capability with generally available software, using any standard network switch, constructed in any standard fabric design (routed Leaf/Spine, L2 with MLAG, etc).
I presented this demo to the VMworld TV crew and embedded it here for your convenience:
How does it work?
It’s really simple, actually. Here’s what I explain in the video:
The virtual switch encapsulates traffic into VXLAN and exports Netflow (IPFIX) data, for every flow, to a collector of your choice.
The virtual switch also exports a template to the collector that allows it to share a lot of additional VXLAN related information for each flow, above and beyond the standard flow information. This includes things such as the outer VTEP IP addresses, and the VXLAN UDP port numbers used to transmit each flow across the fabric. Note: The UDP source port will be unique for each flow.
The physical switches also export Netflow, IPFIX, or sFlow data as they observe these VXLAN flows on the fabric. Any decent switch worth its price tag is capable of doing this.
The flow collector is receiving detailed VXLAN flow data from the virtual and physical switches.
At this point you can go to your collector and pick any flow, in real time or historically, and see where it went on the virtual and physical switches, hop by hop.
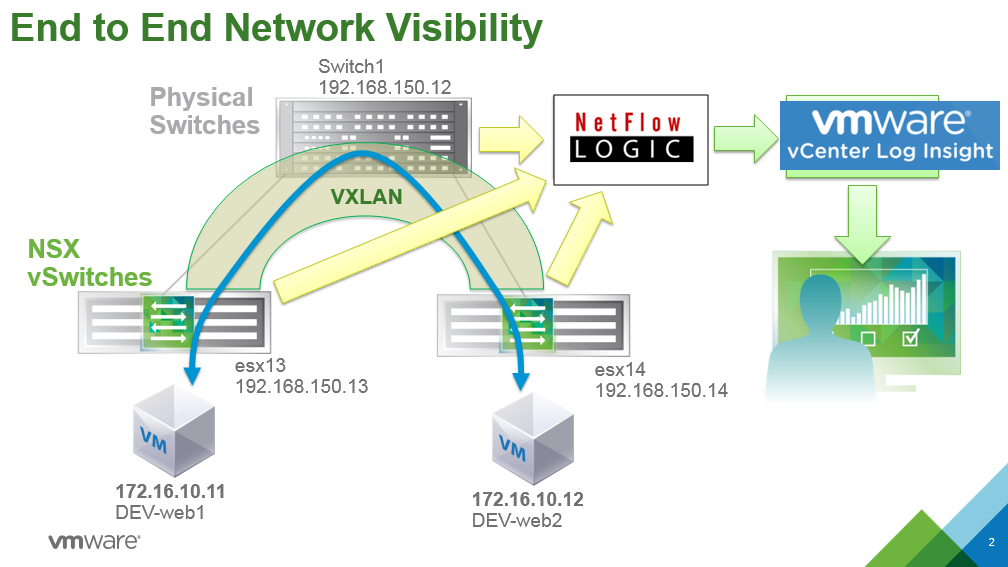
To make it easy to search this data quickly, I decided to use a collector that can aggregate all of that Netflow data and convert it into Syslog messages. This is capability is provided by Netflow Integrator, from Netflow Logic.
With all of my virtual and physical switch flow data now in Syslog, I can easily search and analyze it from Splunk, or VMware Log Insight, or something else.
For example, I can type in queries that narrow in on the flows between any two IP addresses, and pick my time range.
I can see the end-to-end byte and packet count for each flow, bidirectionally, and quickly tell if any packets were lost in the fabric by looking for identical byte and packet counts on each end (hypervisor to hypervisor).
If I want to see where a flow went on the physical network, I can simply query the VXLAN source UDP port used for that flow, and I’ll see every switch and interface that observed that flow.
All of the necessary data is there for analysis by humans, or a machine. Today, I’m typing in queries at a Syslog engine. Tomorrow, it might be a network analysis tool looking at the same data, drawing a nice picture for me, looking for any anomalies, and perhaps making correlations to other events found in the same Syslog data from other IT equipment.
If you take a step back and think about it, Syslog is the perfect means to converge all IT event and troubleshooting data. Dare I say, Big Data. Every flow on your network should be considered an event. Why not? And if properly stored in a common data repository, you have the opportunity to give analytic tools a broad view of what’s happening in your data center, what’s likely to happen, and how to plan for it. Capacity planning. Cross functional troubleshooting. Security forensics. Just to name a few. There’s a lot more to troubleshooting application performance than simply counting packets on the network.