VMware NSX, Convergence, and Reforming Operational Visibility for the SDDC
Note: This article was originally written for and published at the VMware Network Virtualization Blog. The following is a verbatim re-post of the original content.
Through convergence, VMware NSX will substantially reform operational visibility for the era of the software-defined data center.
Executive Summary
Since the launch at VMworld 2013, much of the discussion about VMware NSX has been focused on its core properties of agile and fully automated network provisioning; the ability to create fully functional L2-L7 virtual networks in a software container with equivalent speed and mobility of virtual machines. And while these are very important capabilities of VMware NSX, we believe there is yet another and perhaps equally significant dimension to be discovered. That is, how network virtualization and VMware NSX, through convergence and instrumentation of virtual networks, virtual compute, and the physical network, will substantially reform operational visibility for the era of the software defined data center.
With convergence comes new visibility
Convergence of network and compute is made possible by a platform ideally positioned at the first point in the architecture where these different yet closely related services can reliably coexist. A less obvious yet significant consequence of this is that convergence inherently provides more visibility, for the simple reason that a single platform now offers a consolidated and synchronous view into multiple services and how they relate to each other in real-time. This combined visibility can bring about more sophisticated applications and operational tools than previously thought possible.
Consider the convergence of voice and data enabled by VoIP endpoints and call control software. The combined visibility into the relationship between a data endpoint and a voice subscriber paved the way for services rich collaboration with multimedia, location, presence, and more. This would arguably turn out to be the final preponderant outcome from voice/data convergence, when compared to the obvious initial benefits of infrastructure consolidation.
Similarly, network virtualization enabled by VMware NSX is the convergence of several different yet closely related virtualization services; virtual computing, virtual networks, and the physical network fabric. The initial benefits of agile and automated network provisioning are obvious and significant. However, once again, we will see that convergence enables a perhaps less obvious yet equally significant benefit through the combined visibility into these related services. With network virtualization and VMware NSX, a single platform now has deep visibility into the application environment, the full L2-L7 network services consumed by the applications, and the physical network fabric on to which the services are transported.
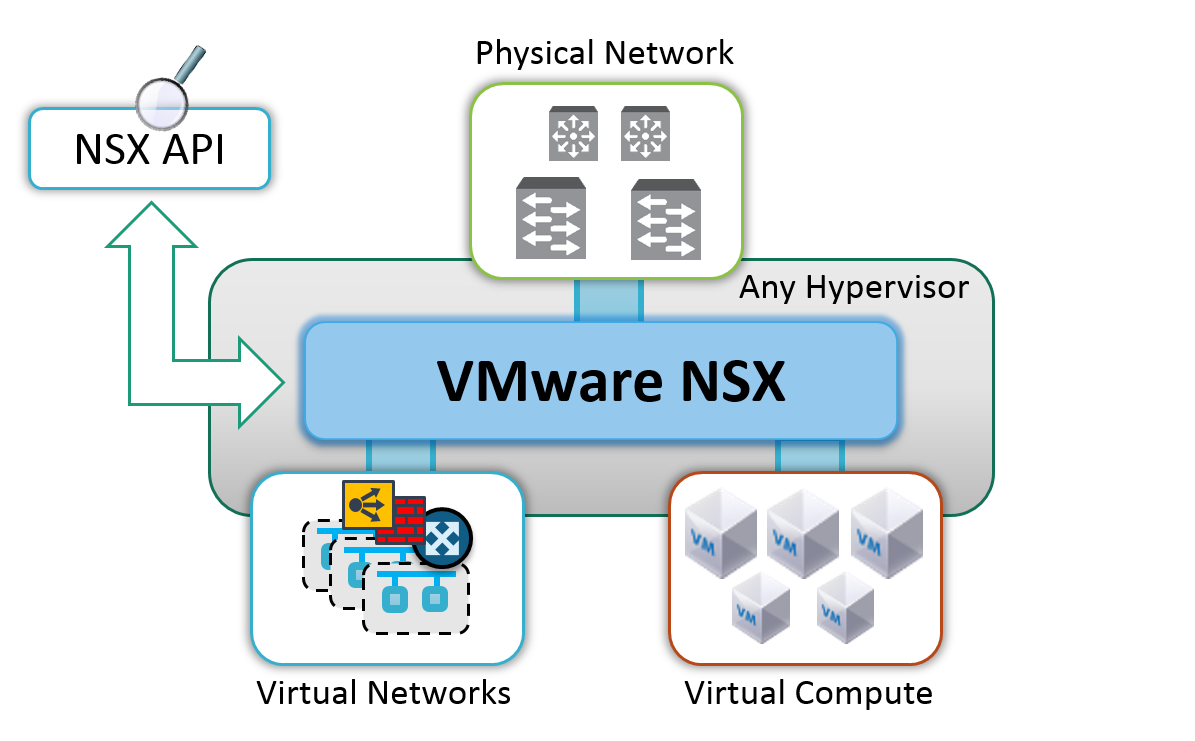
The ideal platform to enable this convergence and visibility is the hypervisor and its programmable software virtual switch. The hypervisor is squarely positioned at the intersection of virtual machines (applications), virtual networks, the physical network, and storage access. VMware NSX fully leverages this strategic position in the hypervisor. And through centralized control software, NSX enables a single point to measure and view in aggregate the fluid relationship between individual applications, the L2-L7 networking services they consume, and the physical network.
As a simple example, consider an application with a tier of N virtual machines associated to a load balancing service. From a single API, it would be possible to see the physical location of each VM, the physical location of their load balancer, measure and profile the traffic between the load balancer and each VM, detect and flag physical network connectivity problems between them, detect and flag misconfigurations on their virtual network ports, identify the instances affected, view the load and health of the load balancer instance, monitor the traffic with port counters and full packet captures, characterize all of this against a baseline or template, and expose this application specific view to the relevant application owners and network operators. Comprehensive and targeted visibility helps you to extract more signal from the noise.
Troubleshooting

Convergence also provides a better foundation for troubleshooting. When one platform has visibility into multiple inter-dependent domains, this provides you a starting point to quickly identify the domain where a problem exists. VMware NSX is ideally positioned in the hypervisor, at the critical intersection of two inter-dependent domains, the virtual and physical network. VMware NSX has visibility into the health and state of the full L2-L7 virtual network. Meanwhile, it’s constantly testing the health of the physical network (with tunnel health probes) between all of the hypervisor virtual switches and gateways, and made viewable in real-time through API queries and heat maps in NSX Manager.
For example, if a physical network issue is causing a connectivity problem, VMware NSX will be able to detect this right away and identify the affected hypervisors and virtual machines. You’ve quickly identified the domain to troubleshoot (physical) and surveyed the scope of the problem with more actionable information to work with at the onset. Conversely, what if a connectivity problem only existed in the virtual network, from perhaps a misconfigured ACL or firewall rule? VMware NSX can identify right away that it’s not a physical network issue, and provides tools to inject and trace traffic through the virtual network (TraceFlow & Port Connections) to pinpoint the virtual switch and ACL dropping the traffic.
Centralized visibility of Blocked Flows in the virtual network
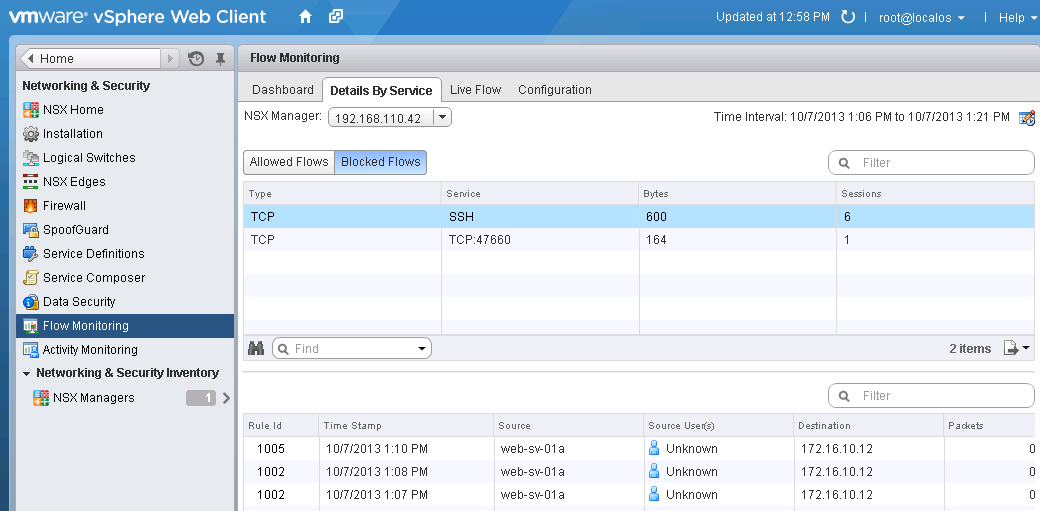
As an example (above), the Flow Monitoring tool provided in VMware NSX for vSphere provides a global view of all flows encountering firewall rules in the virtual network. In a troubleshooting scenario, we can see details (in real time or historically) about individual flows blocked anywhere in the virtual network, including application type, source and destination, time of day, and the specific rules involved. This information is only a few clicks away at any time. All of this actionable intelligence is made available through a single programmatic interface, the NSX API. VMware has already extended existing operational tools to leverage the NSX API, such as with vCenter Operations Manager and Log Insight. Meanwhile, partners are already integrating with NSX and extending their best of breed tools to visualize and correlate the virtual and physical network. Let’s look at a couple of examples.
Visualize and correlate traffic flows from the virtual to physical network
With its position in the hypervisor, VMware NSX is directly adjacent to the applications in the virtual compute layer and has direct visibility into all of the flows. Meanwhile, all of the flow data captured by NSX can be exported with standard interfaces (IPFIX) to a monitoring tool that can also collect standard flow data from the physical network, and correlate both into an aggregate view of virtual/physical flow visibility on any standard infrastructure hardware.
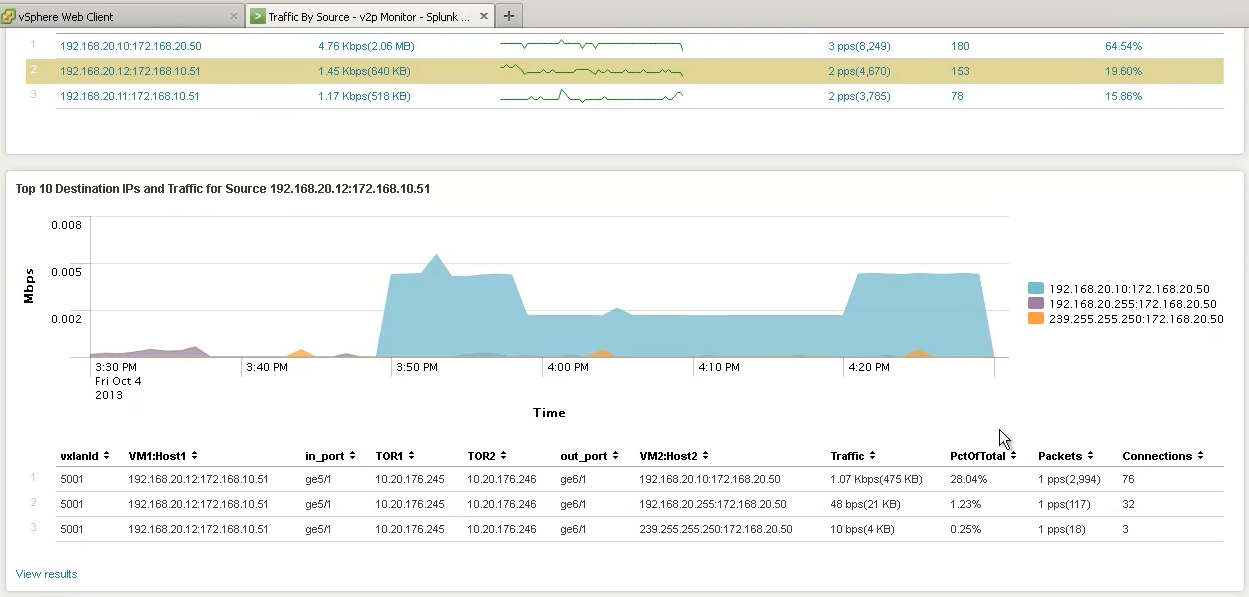
As an example, VMware NSX provides easy integration with NetFlow Logic, and Splunk (above), allowing you to visualize traffic as it flows through the virtual and physical network by simply aggregating and correlating standard IPFIX and Netflow export from VMware NSX and ToR switches. You can view the Top Ten Talkers, select a traffic source and view the virtual network and physical path for that conversation. For example (above), after picking a conversation we can see the virtual and physical details of that traffic such as the source VM IP address > source Hypervisor IP address > source ToR switch and ingress port > virtual network VXLAN ID > destination ToR switch and egress port > destination Hypervisor IP address > destination VM IP address > Tx/Rx connection stats > Bandwidth utilized and time of day.
Visualize and correlate the physical and virtual network topology
VMware NSX knows the physical location of any virtual machine and the complete L2-L7 virtual network topology it’s attached to at all times. NSX also provides standard SNMP interfaces into the operational state of the hypervisor and NSX appliance networking health and stats. With this information easily accessible via the NSX API and SNMP, it’s pretty straightforward for physical network management tool to gain deeper visibility into the virtual network and it’s operational state.
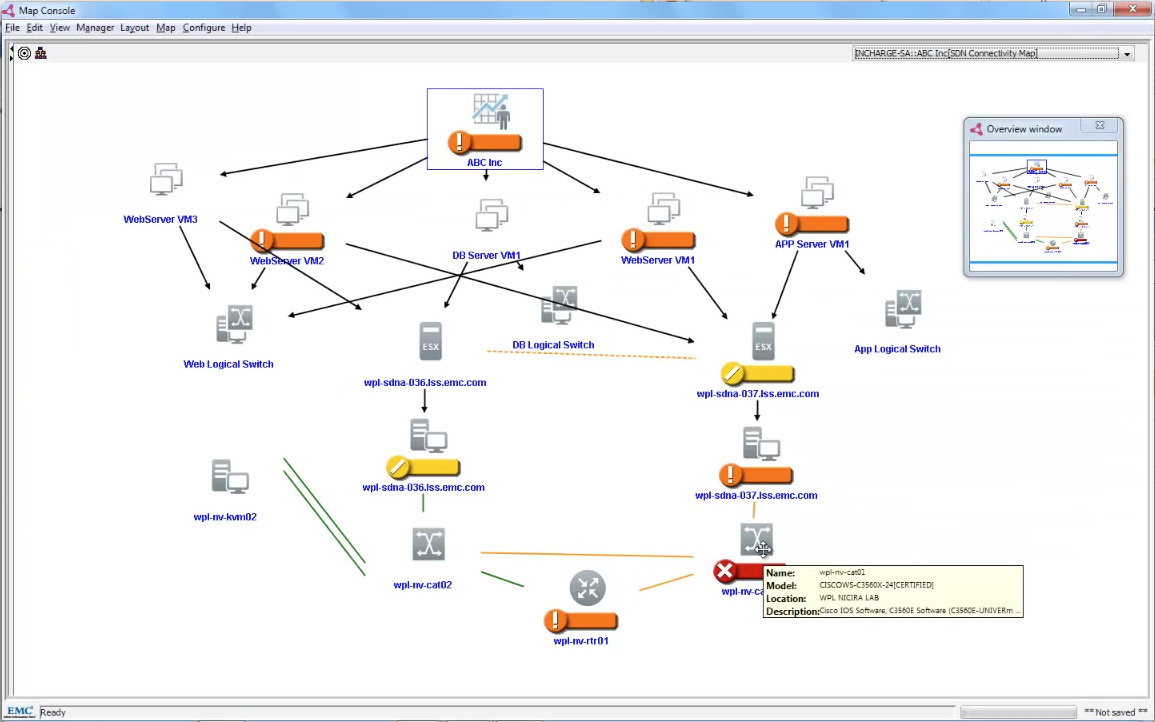
As an example, EMC Smarts integrates with the VMware NSX API and can combine and correlate the physical network topology with the VMware NSX virtual network topology and produce dependency maps. For example (above), if a particular top of rack switch is experiencing and issue you can see a map of the tenant, applications, virtual networks, and hypervisors that would be affected. As another example, this deep level of virtual/physical network visualization and correlation has also been developed by Riverbed in their Cascade solution.
Comprehensive dashboards and analytics with Log Insight
VMware NSX generates a lot of operational data, all of which can be exported through standard Syslog data, and accessible through the NSX API. As an example, VMware Log Insight aggregates and analyzes machine data across multiple VMware platforms, now including VMware NSX (below).

VMware NSX has tight integration with the existing VMware operational tools like vCenter Operations Manager (below) and Log Insight (above). This provides capabilities such as performance analytics and real-time correlation of application processes, virtual machine and virtual network interface stats, physical network interface stats, network health, physical network flow logs, and predictive root cause analysis for complete operational visibility to diagnose issues quickly, across any standard network fabric. We expect these powerful tools will be shared by both compute and network teams.
Comprehensive monitoring and root cause analysis with vCenter Operations Manager
VMware vCenter Operations Manager has also been extended to tap into the wealth of networking information accessible through the VMware NSX API.

The built-in integration of VMware NSX into vCenter Operations Manager (above) coalesces networking visibility from NSX with the existing compute and storage operational data; forming one comprehensive tool for visibility and troubleshooting across the entire virtualization infrastructure. For example, we can see things such as hypervisor CPU, storage, and networking health heat maps, dynamically learn normal thresholds, detect anomalies, drill down into granular metrics, and correlate events for root cause analysis.
With visibility and capability comes substantial reform
On its own the aggregate visibility enabled by VMware NSX is a significant win, but when combined with sophisticated capabilities at the hypervisor virtual switch layer, such as telemetry and L2-L7 network services, previously unthinkable tools can emerge that begin to reform the operational capabilities befitting to a software defined data center. Meanwhile, existing monitoring tools (IPFIX, sFlow, ERSPAN, SNMP, Syslog) are extended to VMware NSX, gaining from the aggregate visibility gathered at the source (hypervisor vswitch); a more relevant position from which to measure and capture in a virtualized environment.
From packet inspection to deep application semantics
For decades packet header inspection has sufficed for “visibility” in the realm of network operations. Maybe it’s a network switch inspecting packet headers to implement a security policy (ACL) or QoS, or an operator sifting through packet headers on a monitoring tool to identify traffic. Either way, the policy and visibility is only as good as the rudimentary information contained in a packet header. For example, we couldn’t tell whether or not traffic is coming from a legitimate application process, versus a rogue or anomalous process. We wouldn’t know if traffic delivered to an instance was actually consumed by a healthy application process. We couldn’t discern the user name, organization, application version, lifecycle (Dev/Test/Prod), and so on. Packet header “visibility” in the physical network (by design) has never had any deep and meaningful insight into the application environment.
By contrast, through convergence of complete L2-L7 virtual networks, embedded with virtual compute at the hypervisor, VMware NSX has deep visibility into application semantics and metadata present at the virtual compute layer.
Application specific and Identity aware visibility (Activity Monitoring)

VMware NSX for vSphere can monitor application relevant network activity down to the individual processes on a virtual machine sending or receiving traffic (above), user identity, organizational groups, application versions, ownership, operating systems, and so on. For example, if you want to zero in on traffic going to a specific application process, destined for a specific set of machines, coming from a specific Active Directory group, you can do that. Only a virtual networking platform deeply embedded with virtual compute can give you that kind of application relevant visibility with ease. Monitoring is just the beginning. This level of visibility could be used to create more sophisticated application templates, behavior profiles, and security policy.
While the application relevant visibility is certainly nice, sometimes you just want to take a quick look at any and all traffic a specific virtual machine is sending or receiving. Of course packet header inspection is still a useful tool for this, and VMware NSX doesn’t necessitate any compromise. In fact, with its position in the hypervisor, NSX can selectively analyze stateful traffic flows in real-time directly at the virtual network interface (vNic) for any virtual machine.
Real-time stateful flow monitoring directly at the virtual machine network interface (Live Flow)

For example, VMware NSX for vSphere provides a built-in tool, Live Flow monitoring (above), which allows you to simply pick any virtual machine’s network interface and see (in real-time) a summary of all flows and their state. You can see a complete breakdown of all the flows at that VM, including the direction of each flow, the number of bytes and packets per flow, the firewall rule each flow was permitted through, IP addresses and port numbers, and the state of each connection. There are no additional steps required. There’s no need configure full packet captures to a remote tool and sifting through IP addresses looking for your VM. For the simple task of targeted network traffic visibility, VMware NSX offers a simple tool. You’re only a few clicks away from this information at any time.
When full packet captures are needed, you can selectively establish port mirroring directly from any VMs virtual network port to a remote monitoring system with SPAN/RSPAN/ERSPAN. And for the situations where you want to capture packets from ports on the physical network, most monitoring tools now provide filters for VXLAN (such as Wireshark) that allow for easy decoding of the tunneled packets.
Security policy and compliance visibility
Of course there’s more to “visibility” than just looking at network traffic and trying to figure out what it is. Troubleshooting is one of many important disciplines that can benefit from the comprehensive visibility provided by network virtualization. Consider for example the task of auditing security policy for compliance. For this, VMware NSX for vSphere provides a central means to define and view real-time application security policy with a built-in tool called Service Composer.
Centralized real-time visibility into security policy and application isolation
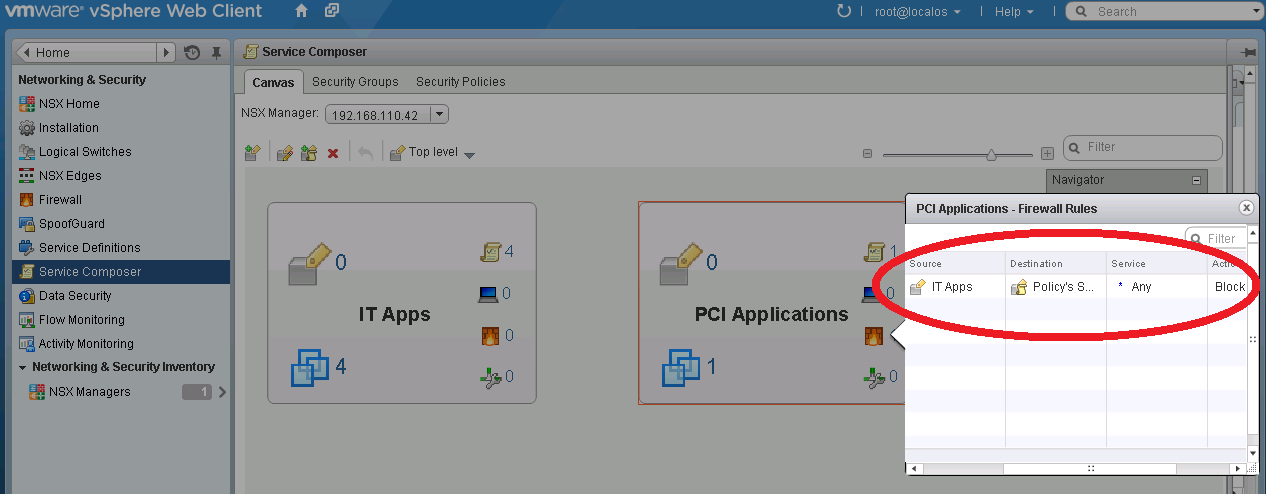
The Canvas view in Service Composer shows the security groups we’ve created, the objects in each group, and the services applied to each group such as stateful firewall isolation. For example (above) we have a security group for PCI applications with a strict isolation policy from the IT applications, and we can see this by simply clicking on the firewall icon in our PCI container. This isolation is enforced by the VMware NSX distributed kernel stateful firewall in the hypervisor and visible in real-time from a central view.
Looking ahead: Measurement, and Intelligent Optimization
With a solid foundation of capabilities, convergence, and visibility in the platform today, entirely enabled by software, we’re excited about what more is possible and the velocity at which we can enable them on any standard hardware or network architecture.
End-to-end Telemetry
An important tool to achieving maximum operational visibility is end-to-end measurement. In addition to knowing the source and purpose of some application traffic, we might want to know the application performance profile and behavior over some period of time, accessible as a data point via the NSX API. True end-to-end telemetry means you’re taking measurements as close to the data source as you can possibly get. To that end, VMware NSX is ideally positioned at the source of traffic (deeply embedded in the virtual compute layer) and implements telemetry with flow-based virtual switches in the hypervisor. Meaning, any conversation between any two endpoints can be accounted for, measured, and marked directly at the source and destination (hypervisor vswitch).
Network DRS
The VMware NSX virtual switch in the hypervisor is capable of L2-L4 network services in the kernel fast path. Things like Layer 2 switching, Layer 3 routing, east-west stateful firewalling, ACL, QoS, can all be locally processed within the hypervisor kernel at x86 machine speeds. Combined with the aforementioned application awareness and end-to-end telemetry, we have all of the information and capabilities needed to intelligently optimize the placement of workloads to obtain the best possible performance for your applications.

For example, consider a multi-tier application where end-to-end telemetry has measured significant traffic between two VMs on tiers separated by Layer 3 routing and firewall security. With that information, the virtual compute layer can decide to migrate the two VMs on to the same hypervisor for the benefit of optimized performance and removing that traffic from the physical network. Optimal placement trumps optimal path.
Consider another scenario where physical network connectivity issues create problems between a given set of hypervisors. Remember that VMware NSX is constantly testing the health of the physical network and can not only discover the problem quickly but also identify the affected hypervisors, network services, and virtual machines. While the physical network issue is being addressed, the virtual compute layer could decide to leverage this intelligence and proactively migrate the affected virtual machines to other unaffected hypervisors. End-to-end telemetry could later validate if the action actually helped or not.
Elephant flow detection and response
Another example of Network DRS is the scenario where end-to-end telemetry in the VMware NSX flow-based hypervisor virtual switch can detect and profile certain flows as “Elephants” – those long lived bulky flows that unwittingly step all over the short lived yet precious “Mice”. With so many potential flows to look at in aggregate, VMware NSX is ideally positioned to distribute this telemetry across the hypervisor virtual switches. Each hypervisor virtual switch measures its own slice of local traffic. Once the Elephants have been spotted they can be tagged and dealt with, such as migrating them away from the precious Mice, and applying QoS markings for visibility and policy in the network fabric.
Visibility on your choice of hardware, cloud, and hypervisor
Of course everything we’ve discussed here is enabled by a software platform, VMware NSX, designed to work on any network hardware, with any hypervisor, provisioned through any cloud portal, and supporting any application. Through hardware-agnostic software, both the operational visibility and capability of the tools remain consistent and normalized across the variations of hardware and network architectures throughout the infrastructure lifecycle.
More to come
VMware NSX is generally available today (yay!) with solid integration to operational tools from VMware and our partners. In the big picture, we think this is only scratching the surface in terms of what VMware NSX is capable of in reforming operational tools for the SDDC. Meanwhile, we continue to get excellent feedback from our customers that will help to shape this platform and the future of networking. It’s going to be a fun ride. I hope you’ll join us. :-)
Cheers, Brad Hedlund Engineering Architect VMware NSBU
Special thanks to: Rod Stuhlmuller, Manish Mittal, Chris King, T. Sridhar